People Living at the Coast Can Feel the Tide

Everybody knows that people living by the sea can feel the tides. They do not need an almanac to know when the next high water will be. Ask one of those grey-haired gents at the pier when the best time to sail with the tide is, and they will briefly scratch their beard and then tell you: five thirty in the morning.
Of course, you go back to your ship to calculate this yourself. You browse the Reeds Almanac for the nearest tidal station, leaf through the tidal stream atlas you bought for a fortune, and make some calculations to finally confirm: 0530 it is. You’re proud to cope with these tidal waters. But there remains a nagging question: how did the local know that by heart?
You remember that there is something like a lunar day that is a bit longer than our 24 hours, and that tides shift by about an hour every day. In fact, the tides invert every week and repeat after about two weeks. Could that explain the grey beard’s magic? You go back and ask him how he did that trick. After two beers he finally explains. High tide is always in the morning at a spring tide. Really?
Testing the claim
The nice thing about a sailor’s folk rule is that it’s testable. Rijkswaterstaat, the Dutch waterway authority, predicts the tides for Terschelling-West — the station nearest the pier where our grey beard is sitting.1 The 2026 table has more than a thousand high and low waters, each with a time to the minute and a height in centimetres above NAP. We can reduce the skipper’s claim to a single question: across all the spring tides of 2026, does high water really always fall in the same narrow band of the day?
Spring tides happen twice a lunar month, when Sun and Moon are aligned (new moon) or directly opposed (full moon), and their gravitational tugs reinforce each other. There are about 24 of them per year. Within ±24 hours of each spring event, the Wadden Sea produces four high waters.
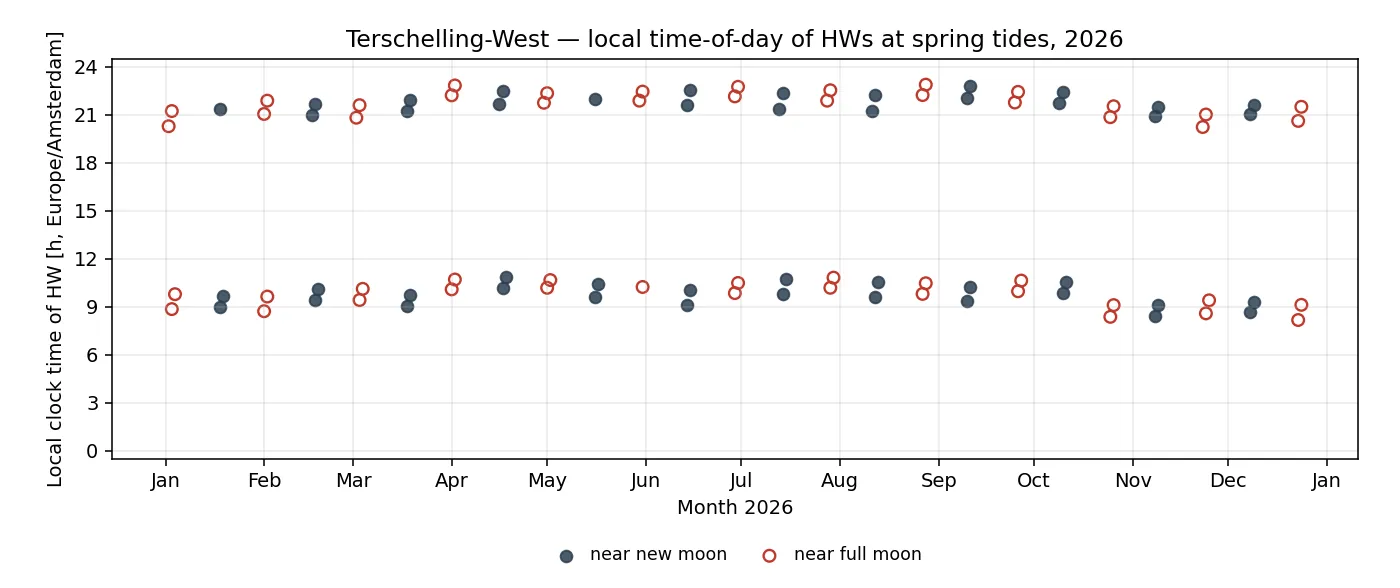
Local clock time (Europe/Amsterdam) of every high water occurring within ±24 h of a full or new moon on Terschelling-West during 2026. Filled markers are high waters near new moons, open markers near full moons. Two thin horizontal bands, twelve hours apart, barely drift across the year.
Two tight horizontal bands. No annual wander, no seasonal drift, no surprises. The numbers come out cleaner than most laboratory experiments: high water at a spring tide on Terschelling occurs at 09:44 ± 41 min in the morning and 21:44 ± 41 min in the evening.
The grey beard at the pier is not practising magic. He is a walking tide table compressed into one number.
The number hidden in his beard
That number is called the lunitidal interval, and every tidal port has its own. It is the stable lag between the Moon crossing the local meridian (directly overhead, or directly underneath on the far side of the Earth) and the next high water at that port. For Terschelling-West, it is 9 hours and 44 minutes. At a full moon, the Moon is opposite the Sun and therefore crosses the meridian around midnight local time. Add 9 h 44 min, and you get high water at 09:44.
This is not an approximation, and it is not new. Before harmonic analysis was worked out by William Thomson (Lord Kelvin) in the 1860s, every port kept its own “establishment” — the lunitidal interval at full and new moon — and mariners computed high water in their head from the phase of the Moon they saw the night before. The grey beard did not invent the method. He inherited it, quietly, from several centuries of excellent Frisian sailors.
Could we predict the whole tide the same way?
If one number captures the timing of spring high water, could a handful of numbers capture the whole tidal curve? One high water and the next low water: can we build a model from those?
The simplest usable model is a cosine, the period is 12 hours, 25 minutes, 14 seconds.2 This is the Moon’s half-daily pull on the ocean, called the M2 curve.
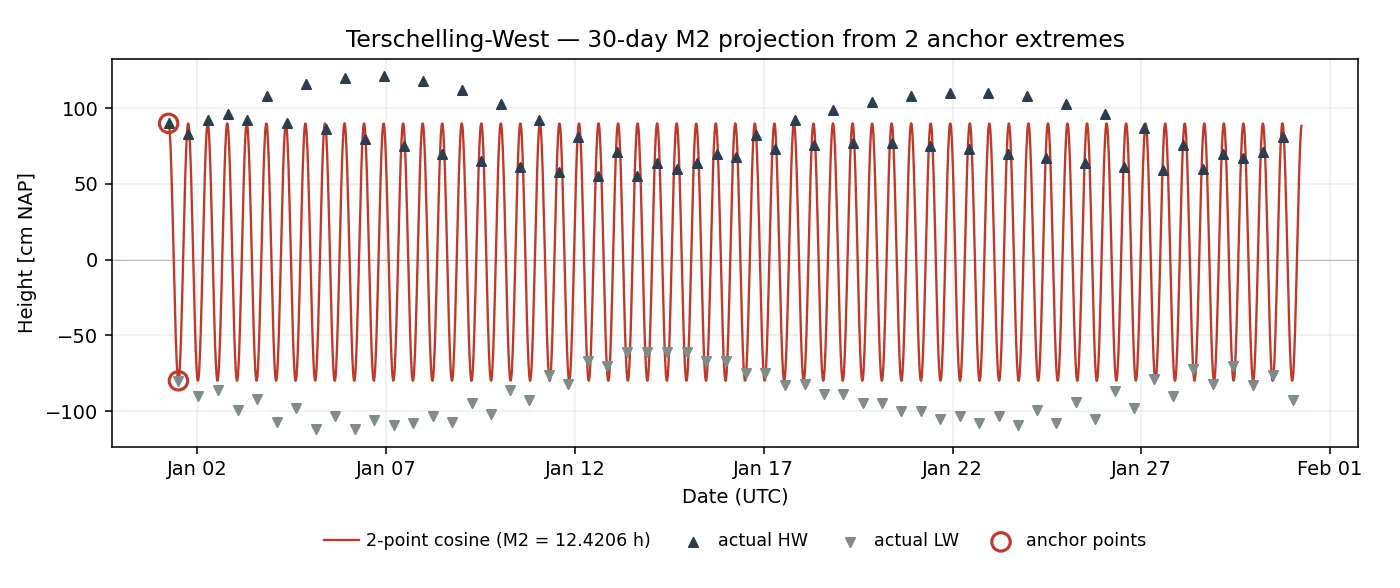
Thirty-day projection of an M2 cosine fitted to the first high water and following low water of 2026 (the two open red circles), overlaid on the actual recorded extremes. The constant-amplitude prediction matches well near the anchor pair and drifts by up to ±30 cm near spring peaks (around 5 and 22 January) and neap troughs (around 13 and 28 January).
The prediction is not wrong. But the real tide breathes in and out on a two-week rhythm that a single cosine cannot see: the spring–neap cycle, where the Sun reinforces (spring) or opposes (neap) the Moon’s tug. Actual high waters in the plot rise above our red line around 5 and 22 January and shrink below it around 13 and 28 January — a modulation of roughly ±30%.
How long is it useful for?
The grey-bearded skipper told us the exact hour to leave the harbour. He said he knows because high water is always in the morning at a spring tide. But it’s not spring tide right now, so how can he know?
To put a number on this, let’s run the projection as a sliding experiment. For every Monday of 2026 we pretend a skipper has written down 24 hours’ worth of extremes — two high waters and two low waters — fit an M2 cosine to those, and extrapolate forward for two weeks. The published truth tells us when the model breaks.
Aggregated across 46 weeks:
- Timing accurate to ±30 minutes: median validity about 3 days (interquartile range 2–5 days).
- Height accurate to ±30 cm: median validity about 6–7 days (interquartile range 4–10 days).
Three days is how long the skipper can predict the tides based on his two data point-based prediction, then he has about a coin-flip chance of being more than half an hour off on the next high water. Tidal height is easier to guess than time, but after a week, the spring–neap envelope takes over and heights differ by more than 30 cm. Time to visit the pier again and look for the grey beard.
But half an hour is a strict standard. Relax the acceptance to an hour and the median horizon stretches from three days to about five — a useful gain, but still short of a full week. The first week of 2026 happens to be a lucky one: every high water lands within an hour of the predicted peak right through to 8 January.
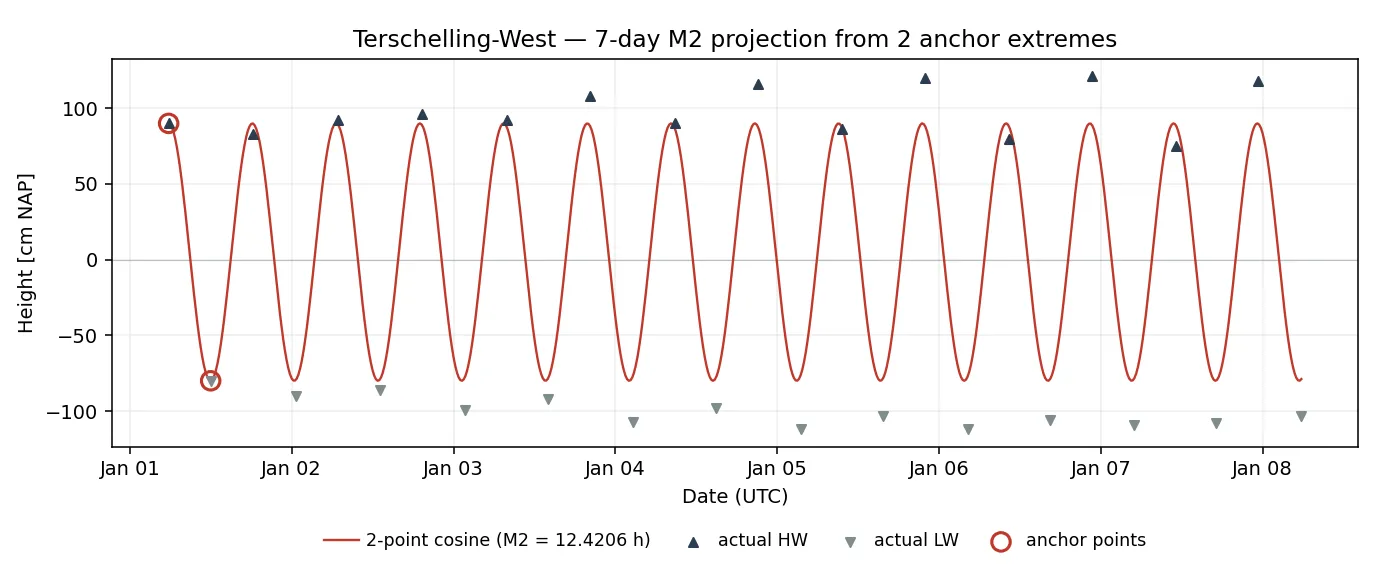
The same two-point cosine zoomed to the first seven days of 2026. HW triangles sit within about an hour of each red peak across this whole week, while heights drift upward toward spring tide. Timing is the slow quantity here; the envelope is the fast one.
If an hour is precise enough, the skipper doesn’t need a cosine. Adding a round 25 hours to the last high water gives tomorrow’s — good for about four days. Use the exact lunar day of 24 h 50 min and you buy another day or two before the envelope catches up.
The real ceiling is not which two points the skipper chose, or how precisely he wrote them down. The ceiling is the spring–neap envelope itself, which no two-point cosine can see.
So how do the pros do it?
Lord Kelvin’s insight was that the tide at any port is a sum of cosines. He used Joseph Fourier’s method to find the oscillatory components of a tidal curve and developed the first mechanical tide-predicting machine that utilized pulleys and wires to combine two dozen harmonic components.3 A year’s tidal curve could be drawn in just a few hours.
The Moon’s principal semi-diurnal pull (M2) is one such cosine, the Sun’s (S2) another. The Moon’s elliptical orbit contributes N2; the varying declinations of Sun and Moon add the diurnal K1, O1 and P1; shallow estuaries pile the water up and spawn overtones at twice and three times the main frequency (M4, M6). Arthur Doodson, a British mathematician and oceanographer, catalogued nearly 400 such terms in the 1920s, and modern hydrographic offices carry 60 to 100 of them per port.4
Even those hundreds of cosines don’t land at each port unchanged. The tide is not a bulge that sits under the Moon and waits; in every ocean basin it rotates as a Kelvin wave around amphidromic points where the range falls almost to zero. The North Atlantic has one in mid-ocean; the North Sea has three of its own, and the wave swings counterclockwise around each pivot.5 When it is high water on the English side of the North Sea it can be near low water on the Dutch side. The water “swaps” coasts on an astronomical schedule depending on the local geometry.
The shape of coastlines adds a further layer: friction, narrow estuaries, and reflecting coasts all shift phases and spawn overtones. This is what a hydrographic office measures, calculates, and stores for each tidal station. Harmonic analysis – nowadays performed by computers – still leads to predicted tides in the almanac.
What the grey beard knew
The local grey-bearded skipper on the pier carries exactly one number — his port’s 9 h 44 min lunitidal interval — and from it predicts a narrow slice of the tide: the timing of high waters at spring tides. That is a piece of information he could verify once a fortnight, for years, and so he did. Every new moon and every full moon was another data point, silently averaged into his estimate of the establishment of Terschelling-West.
What you cannot calculate from that, without an almanac, is next Tuesday’s range at neap. For that, you need more numbers — the harmonic constants of the port, or a table of predicted extremes. The two-point experiment shows exactly where the boundary sits: a couple of skipper-entered values, plus the Moon’s period, will hold you for about three days before the envelope walks away.
There might be more to get out of that grey beard. Buy him the third beer.
Footnotes
- High and low water predictions for Terschelling-West obtained from Rijkswaterstaat (Dutch Ministry of Infrastructure and Water Management). Annual tide tables are published at getij.rijkswaterstaat.nl.
- The principal lunar semi-diurnal constituent (M2) has a period of exactly half a mean lunar day: 12 h 25 min 14.16 s, derived from the Moon’s synodic motion relative to the Earth. Pugh DT, Woodworth PL. Sea-Level Science: Understanding Tides, Surges, Tsunamis and Mean Sea-Level Changes. Cambridge University Press, 2014, Table 4.1.
- Thomson W. The tide gauge, tidal harmonic analyser, and tide predicter. Proc Inst Civ Eng 1881;65:2-25. The first Kelvin tide-predicting machine, built 1872-73, combined ten harmonic components; later British and US Coast and Geodetic Survey machines extended this to twenty or more.
- Doodson AT. The harmonic development of the tide-generating potential. Proc R Soc Lond A 1921;100:305-329. Operational tide prediction at modern hydrographic offices typically uses 60 to 100 constituents per port, with shallow-water overtones added for estuarine stations.
- The North Sea M2 tide rotates counterclockwise (cum sole in the Northern Hemisphere) around three amphidromic points: one south-east of East Anglia, one in the German Bight, and one off southern Norway. Pugh DT, Woodworth PL. Sea-Level Science. Cambridge University Press, 2014, Chapter 5.